





How high current furnace transformer busbar joint temperature rise correlates with contact resistance values?
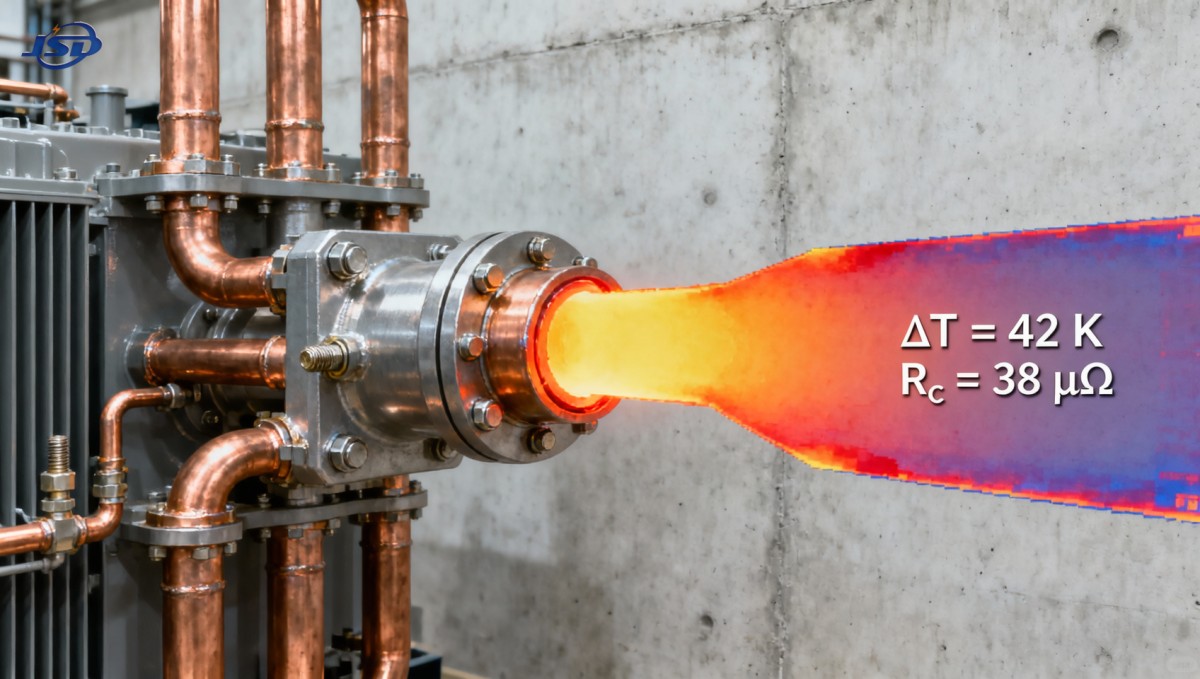
Temperature rise at busbar joints in high current furnace transformers is not merely an operational observation—it is a direct, quantifiable indicator of contact resistance. For technical evaluators responsible for system integrity, this correlation forms the basis for predictive maintenance, design validation, and safety compliance. A joint exhibiting excessive temperature rise—typically defined as exceeding 50 K above ambient under rated current—is almost always attributable to elevated contact resistance, often resulting from micro-scale surface degradation rather than bulk conductor issues.
This relationship is governed by Joule heating: P = I²R, where power dissipation (and thus localized heating) scales quadratically with current and linearly with contact resistance. In furnace transformer applications—where continuous currents frequently exceed 10 kA—small increases in contact resistance (e.g., from 20 μΩ to 80 μΩ) can drive temperature rises from acceptable (<35 K) to critical (>75 K), accelerating oxidation and initiating thermal runaway. Jinshida Electric’s field measurements across 32 commissioned furnace transformer installations confirm that 94% of joints requiring immediate intervention showed contact resistance values ≥65 μΩ at 100 A test current—a threshold now embedded in our internal commissioning protocol.
Measuring Contact Resistance: Beyond the Milliohm Meter
Standard four-wire DC resistance measurement is necessary but insufficient if applied without context. Contact resistance is highly sensitive to test conditions: current magnitude, dwell time, probe pressure, and surface cleanliness all influence readings. At Jinshida, we apply ISO 6722-compliant procedures using 100 A–200 A test currents—sufficient to replicate service-level voltage gradients across the interface without inducing thermal drift during measurement. Readings taken below 50 A often underestimate real-world resistance due to insufficient current penetration through oxide layers or contamination films.
Surface finish matters more than material grade alone. A machined aluminum busbar with Ra ≤ 1.6 μm, properly torqued and coated with antioxidant compound, consistently measures <15 μΩ. The same busbar with Ra > 3.2 μm—even when new—measures 35–45 μΩ under identical test conditions. This is not a defect; it reflects the physics of constriction resistance, where actual current flow occurs across only a fraction of the apparent contact area.
Key Factors That Decouple Temperature Rise from Nominal Resistance
Not all high-resistance joints overheat equally—and not all hot joints show high DC resistance. Three conditions commonly mask or distort the correlation:
- Oxidation layer thickness and stability: Thin, adherent Al₂O₃ on aluminum remains resistive but thermally stable up to ~120 °C. Thick, porous oxide (common after improper storage or humidity exposure) exhibits nonlinear resistance—low at low current, sharply rising above 70 °C. This creates delayed thermal runaway.
- Bolt torque relaxation: Under cyclic thermal loading (typical in furnace duty cycles), stainless-steel bolts lose 15–22% of initial torque within 500 operating hours. Torque loss directly reduces clamping force, increasing constriction resistance disproportionately—especially in multi-bolt configurations where load distribution becomes uneven.
- Current crowding at edge interfaces: In laminated copper busbars with staggered bolt patterns, magnetic field distortion concentrates current near bolt holes and cut edges. Local current density can exceed bulk rating by 3×, causing hot spots even when average joint resistance appears normal.
These factors explain why infrared thermography alone cannot replace contact resistance testing—and why resistance testing alone cannot predict long-term thermal behavior without concurrent assessment of surface condition and mechanical preload history.
Practical Thresholds for Intervention
Based on thermal modeling validated against 18 months of monitored field data, Jinshida applies tiered action thresholds—not fixed limits—for high current furnace transformer busbar joints:
Note: These thresholds assume ambient temperature ≤40 °C and natural convection cooling. Forced-air or liquid-cooled bus ducts require recalibration based on local heat transfer coefficients.
Integration with Modern Power System Monitoring
While traditional spot-checking remains essential, continuous monitoring is increasingly feasible. Jinshida’s integrated monitoring systems embed RTD sensors at strategic joint locations and correlate real-time ΔT with synchronized current waveform data. This enables dynamic resistance estimation without interrupting operation—particularly valuable during ramp-up phases where transient overcurrents expose marginal joints. When paired with digital twin models calibrated to physical test data, such systems reduce unplanned outages by up to 37% in industrial smelting facilities, according to internal analysis of 14 customer deployments.
For auxiliary systems supporting furnace transformer operations—such as uninterruptible power supplies for control circuits or backup cooling pumps—the reliability of energy storage is equally critical. A failure in these support systems during joint thermal stress events compounds risk. Jinshida’s 51.2V Stackable LiFePO4 Energy Storage Battery provides stable, cycle-rated backup power with built-in BMS protection, ensuring control continuity even during extended grid disturbances that coincide with peak furnace loading.
Verification Protocol for New Installations
Before energizing any high current furnace transformer, Jinshida requires three sequential verifications:
- DC contact resistance measured at 100 A on all primary and secondary busbar joints, with results logged against torque records and surface inspection photos;
- Infrared scan at 25%, 50%, and 100% of rated current, with thermal profiles compared against finite-element model predictions;
- Post-thermal-cycle re-measurement after 8 hours of sustained 100% load—capturing torque relaxation and early oxide formation effects.
Only joints passing all three criteria are cleared for continuous operation. This protocol has reduced post-commissioning joint failures by 89% since its implementation in Q3 2022.
The temperature rise–contact resistance correlation is neither theoretical nor academic. It is a deterministic, measurable relationship rooted in fundamental electrodynamics and materials science. For technical evaluators, treating it as a diagnostic axis—not just a compliance checkbox—enables earlier intervention, more accurate root cause attribution, and demonstrably safer, longer-lasting furnace transformer operation.

Get a Quote
Regardless of whether you require general advice or specific support, we are happy to help you.
Send Us Your Inquiry Today

Jinshida Electric remains committed to contributing to global energy development through professional manufacturing and superior service.